
The Weekly Financial Point by Il Chiaro Finanziario: September 15 – 20, 2025
Table of Contents
Economic Analysis: The Data That Defines an Uncertain and Contradictory Picture
This week was rich with important economic data that created an uncertain and contradictory picture. The Fed Rate Cut, in particular, dominated the news, marking a turning point in monetary policy. Central banks, facing increasing uncertainty, are at a crucial crossroads. The debate remains wide open, and the next moves could have a monumental impact on the economic future.
The News of the Week: The Fed Cuts Rates
After months of waiting and speculation, the Federal Reserve announced a quarter-point cut to interest rates, bringing them to 4.25%. This decision was not made lightly but reflects growing concern about the state of the labor market and the slowdown in some key sectors. The move marks a turning point in monetary policy and acts as a catalyst for all the economic and financial dynamics we will analyze in this report.
1. The Deep American Paradox: Growth vs. Labor
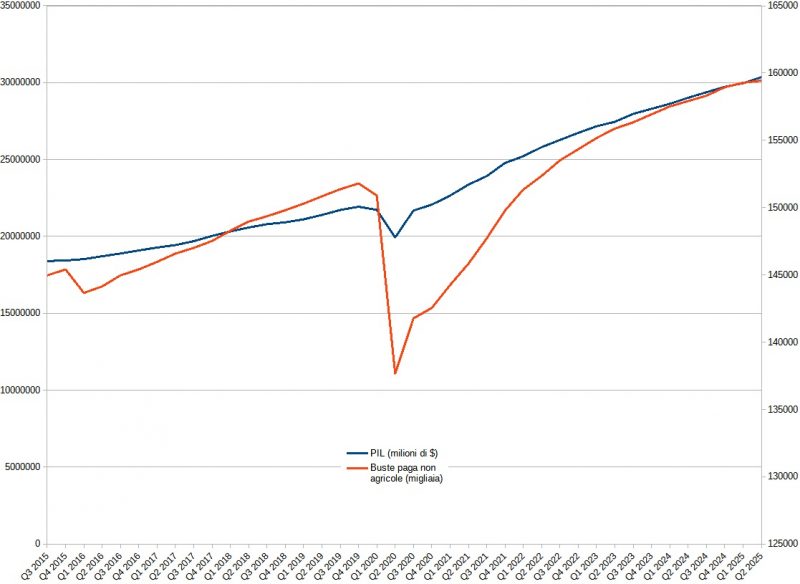
This week, the most-discussed data point was the one that highlighted the deep paradox of the American economy: strong growth that isn’t creating new jobs at the same rate as in the past. The wealth produced by the economy (GDP) showed constant and impressive growth since 2015, exceeding the 30 trillion dollar threshold in 2025. This data, clearly visible in the chart, suggests robust economic health and a complete recovery after the 2020 downturn.
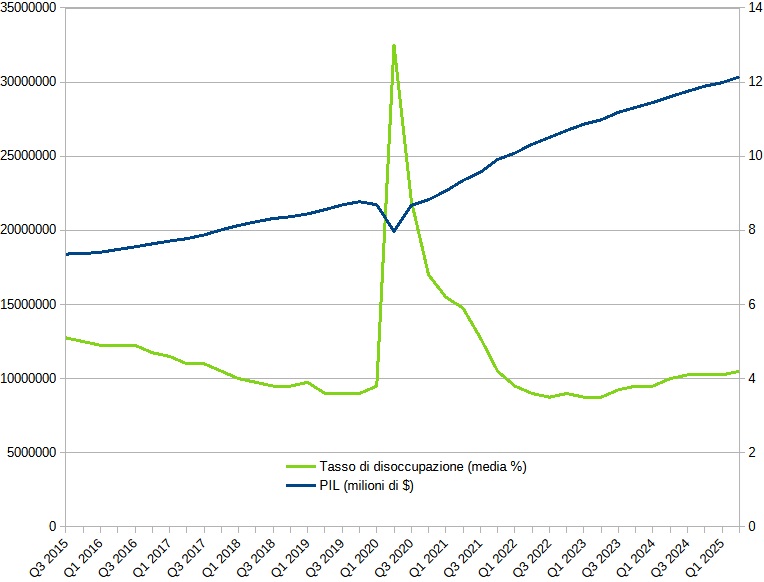
However, the labor market, despite being in a state of near full employment, no longer generates payroll volumes like it once did. Non-farm payrolls have grown more slowly and moderately compared to the GDP. Although the unemployment rate has remained extremely low, fluctuating between 3% and 4% in recent years (apart from the 2020 peak), the number of new jobs created is less impressive when compared to overall economic expansion.
This phenomenon deviates from the historical trend, where GDP growth was almost always accompanied by a robust and proportional increase in jobs. In the 90s, for example, a growing GDP translated into an explosion of hiring, especially in the rapidly expanding tech sector. Today, the link between these two indicators seems to have loosened, forcing analysts to revise their theories. The question everyone is asking is: if the economy is growing, who is doing all the work? The answer lies in another part of the economic picture: productivity.
2. The Data that Explains the Contradiction: Productivity and Inventories
The key to understanding this paradox lies in two interconnected factors: productivity and the use of inventories.
Productivity as a Growth Engine
Unlike in the past, companies have become much more efficient. This means that, thanks to the adoption of new technologies, automation, and artificial intelligence, they can produce more with less personnel. The increase in productivity perfectly explains how GDP can grow at a sustained pace even if the number of new hires is not equally high. Sectors like manufacturing and technology are at the forefront of this transformation, investing heavily in automated processes that reduce the need for additional labor.
This phenomenon, while a sign of technological progress and efficiency, creates a disconnect between overall economic performance and job opportunities for the masses. In the chart, you can see that while the GDP line continues its ascent, the payroll line, after the post-pandemic rebound, follows a less steep slope, reflecting precisely the impact of greater productivity.
The Use of Inventories as a Temporary Boost
Another factor that has contributed to GDP growth is the strategic use of warehouse inventories. Companies have seen a significant increase in sales, but they did so in part by emptying warehouses rather than increasing production to meet demand. This suggests that sales growth is based on lower-cost products and may not be sustainable in the long term. Once inventories are depleted, companies will be forced to slow down sales or invest heavily in new production, which could lead to an economic slowdown or, conversely, a surge in hiring, creating an even more unpredictable picture.
The data this week also raised other red flags, suggesting that the economic recovery is fragile and presents significant risks in the long run.
The Burden of Public Debt
Public debt continued its ascent, reaching the impressive figure of 37.27 trillion dollars, a value exceeding 124% of GDP. This data suggests that a substantial part of the economic growth has been financed through an increase in borrowing. In an era of high interest rates, debt service costs are becoming an increasingly heavy burden on public finances, limiting the government’s ability to invest in infrastructure, education, or other key areas for future growth. This cycle of debt dependence is a high-risk strategy that could undermine long-term economic stability.
The Real Estate Market in Crisis
The real estate market, traditionally a pillar of the economy, also shows signs of profound weakness. Home sales and building permits are down, a clear signal that the increase in interest rates has made mortgages unaffordable for many buyers and has discouraged new construction. The crisis in the real estate sector has a ripple effect on the entire economy, influencing related sectors such as furnishings, construction, and building materials. This weakening of the real estate market acts as a counterweight to GDP growth, making the entire economic recovery less solid than the main data may suggest.
4. Global Markets Compared: Resilience and Fragility
While the American economy faces its contradictions, global financial markets reflect a deep divergence. The performance of stock indices in different parts of the world tells a story of resilience, particularly in the United States, but also of growing fragility elsewhere.
The Strength of the United States and the Euphoria of Japan
US markets show remarkable solidity: the S&P 500 has hit new all-time highs and the NASDAQ has risen, driven by the tech sector. The more traditional Dow Jones is also moving into positive territory. This strength is partly attributable to the US dollar’s role as a safe-haven currency. Another exceptional performance is that of the Nikkei 225 in Japan, which is reaching new records in a wave of post-election euphoria.
The Caution of European Markets and Asian Volatility
In contrast, European markets show a more mixed picture. The FTSE 100 and the DAX have registered weakness, with clear profit-taking after hitting highs. The French CAC 40 has remained in a “stand-by” phase, failing to show a clear direction. In Asia, while the Hang Seng had a rally driven by China, the Shanghai Comp. underwent a technical retracement, and the Australian ASX 200 felt pressure from commodity prices. This divergence highlights that, despite being globalized, markets react differently to local challenges and opportunities.
| Index | 1-week Performance | 1-month Performance |
| FTSE 100 (UK) | -0.7% | -1.0% |
| Shanghai Comp. (CHN) | -1.3% | +1.3% |
| NASDAQ (USA) | +2.2% | +7.3% |
| ASX 200 (AUS) | -1.0% | -2.7% |
| Hang Seng (HK) | +0.6% | +5.7% |
| S&P/TSX (CAN) | +1.7% | +6.1% |
| S&P 500 (USA) | +1.2% | +4.6% |
| CAC 40 (FRA) | +0.4% | -1.1% |
| Dow Jones (USA) | +1.0% | +3.4% |
| DAX (GER) | -0.2% | -2.7% |
| Nikkei 225 (JPN) | +0.6% | +5.7% |
6. Stock of the Week: MetLife
MetLife is one of the largest and most important insurance and financial services companies in the world. It operates in over 40 countries and offers a wide range of products, including life insurance, health insurance, pension plans, and wealth management services. MetLife (NYSE:MET) shows a solidity that does not go unnoticed: a P/E of 15.9x, a dividend yield of 2.7%, and an impressive Free Cash Flow Yield of 26.8%. The stock trades at $79.16, with an average analyst target of $92.07 (+14.8% potential upside), but the estimated Fair Value rises to $103.97 (+31.3%).
Additional Highlights:
- Perfect Piotroski Score (9): indicates superior financial quality.
- Strong growth in basic EPS: +228.5% in 2024.
- Total shareholder yield: 114.9% (dividends + share buybacks).
- Solid liquidity: Current ratio 1.5x, liquid assets > short-term obligations.
Perspectives and Risks
Growth and solidity: Revenue is growing (+6.1% in 2024, an estimated +5.8% for 2025), and net income is positive with a margin (6.2%). ROE is robust (14.7%), with a contained payout ratio (39%). MetLife has increased its dividend for 12 consecutive years and has been paying dividends for 26 years.
Risks to monitor: 8 analysts have revised future earnings estimates downward. The Debt/Equity is high (235.6%), which needs to be evaluated for sustainability in a high-rate environment.
The Verdict
MetLife offers one of the most attractive quality/price ratios among large insurers: solidity, dividends, buybacks, and growing margins, but be mindful of indebtedness and negative earnings revisions. The Fair Value suggests a still-consistent upside compared to current prices.
Disclaimer and Source This content is for informational purposes only and is not investment advice. Source: Trading Economics, Investing.com, Bureau of Labor Statistics, Reuters, Tradingview.