Which Parameters to Look At: How to Choose the Best ETF
Table of contents
After understanding what ETFs are and the main differences between ETFs and mutual funds, you might be thinking about including them in your investment strategy. However, just knowing what they are isn’t enough to invest wisely. Facing the vast offer of ETFs available, the real therefore becomes: how to choose an ETF among so many?
There isn’t an absolute “best ETF,”of course, but there is one that is best suited to your goals. To make an informed choice, it’s essential to look beyond the name and the benchmark and analyze some key parameters. In this article, we will see together what these parameters are and why they are important to guide you in the process of how to choose the ETF that aligns with your needs.
Not All ETFs Are Equal: Why Learn How to Choose
At first glance, all ETFs that replicate the same index (for example, an ETF on the S&P 500 index) might seem identical. After all, their goal is simply to replicate the performance of that benchmark. However, looking closer, substantial differences emerge between different ETFs that track the same index. Indeed,these differences, often related to costs, the way they replicate the index, or their liquidity, can have a significant impact on the final returns the investor will obtain over time. Therefore,learning how to choose an ETF means knowing how to identify these distinctive factors to select the most efficient instrument suitable for your needs.
The Fundamental Parameters to Consider When Choosing ETFs
Deciding how to choose an ETF requires looking beyond the simple name of the replicated index and carefully examining some technical data that describes its functioning, efficiency, and characteristics. Indeed,these parameters, often summarized in information sheets (like the KIID) and on the fund managers’ websites, are the key to comparing similar instruments and identifying the one that is best suited for you.
Specifically, among the fundamental parameters to analyze we find: the Cost (TER), the Tracking Difference, the Replication Method, the Liquidity, the Fund Size, the Currency, and the Dividend Policy.
Now, let’s see together what these parameters mean and why they are important in the process of how to choose an ETF.
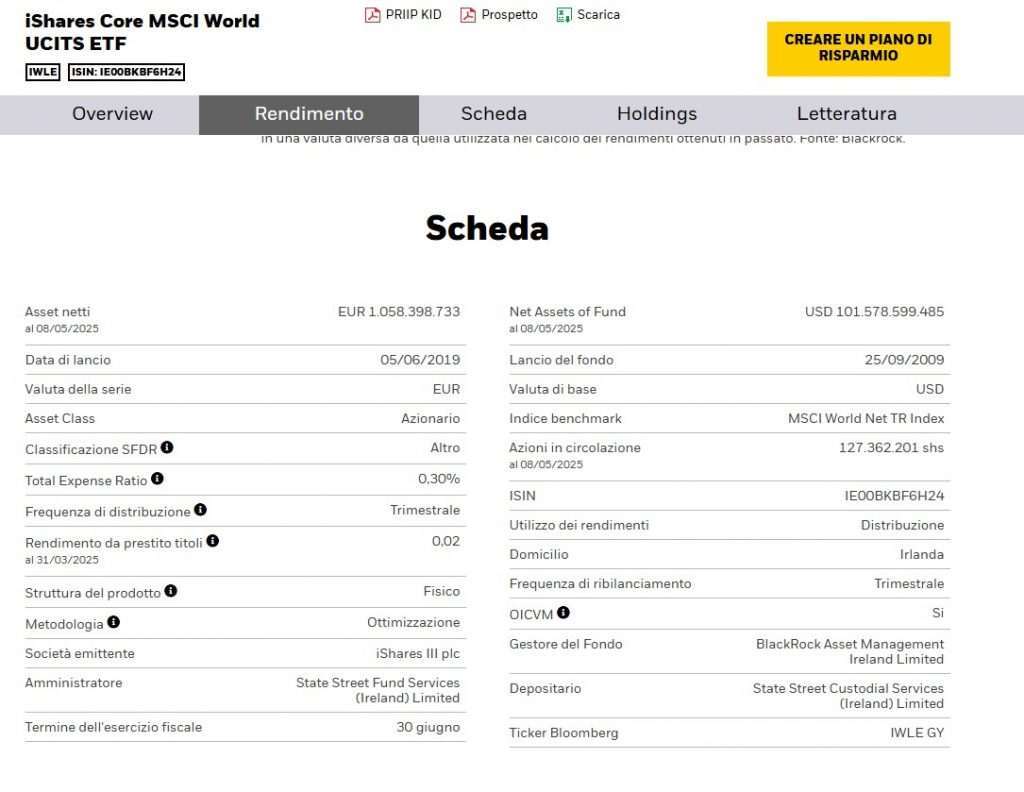
Image taken from the iShares website
The Cost (Total Expense Ratio – TER)
One of the most important parameters to consider when choosing an ETF is the cost, mainly expressed through the Total Expense Ratio (TER). The TER is an annual percentage that represents the sum of all the fund’s operating expenses (management fees, administrative costs, etc.). This cost is deducted automatically every day from the fund’s value and directly affects your final return.
A low TER is generally preferable because it means that a smaller portion of the fund’s return is eroded by expenses. ETFs, especially passively managed ones, are known for generally having much lower TERs compared to actively managed mutual funds.
Looking at the example of the iShares Core MSCI World UCITS ETF (IWLE) that we saw above, you can see that the Total Expense Ratio is indicated as 0.30%. This means that each year, 0.30% of the value of your investment in this specific ETF is used to cover the fund’s operating expenses.
It is essential to compare the TER between different ETFs that replicate the same index, as even small percentage differences can have a significant impact on long-term returns, thanks to compounding.
The Tracking Difference
While the TER tells you how much it costs to manage the ETF, the Tracking Difference tells you how much the ETF managed to perform differently from its benchmark index over a given period. In other words, it is the difference between the benchmark’s return and the ETF’s actual return.
A negative Tracking Difference (the ETF returned less than the index) is normal and expected, because it includes costs (TER) and other small inefficiencies (like dividend taxes). The goal is to find an ETF with a Tracking Difference as close to zero as possible (or as little negative as possible), because it means it replicates the index very faithfully net of costs.
It is important not to confuse the Tracking Difference with the Tracking Error. The Tracking Error measures the volatility or consistency of the tracking difference over time, indicating how much the ETF’s daily or weekly variations deviate from those of the index. A low Tracking Difference is usually the primary goal for a long-term investor because it directly impacts the final return.
In the example of the iShares Core MSCI World UCITS ETF (IWLE) , the performance chart (“Performance” with “Total return (%)” vs “Benchmark (%)”) visually shows this tracking difference year by year. You can see how the ETF’s return (blue line/dark bar) closely follows that of the Benchmark (light line/bar), but is slightly lower in most years – that small difference is the annual Tracking Difference.
The Replication Method (Physical or Synthetic)
To track an index, an ETF must own or simulate the performance of the securities that make up that index. There are two main replication methods:
- Physical Replication: In this method, the ETF physically purchases the securities that make up the index, usually in the same proportions as the index itself (this is full physical replication). For very broad indices (with hundreds or thousands of securities), the manager might use physical sampling or optimization: they buy only a representative sample of the index’s securities, aiming to achieve a return as similar as possible. In the example of the iShares Core MSCI World UCITS ETF (IWLE), you saw that the Product Structure is “Physical” and the Methodology is “Optimization”. This means the ETF physically holds the securities but uses an optimized sampling strategy instead of buying every single security in the MSCI World index.
- Synthetic Replication: In this method, the ETF does not physically own all the index’s securities. It uses financial derivatives, such as swaps, entering into an agreement with a counterparty (usually a large investment bank). The ETF receives the index’s return from the counterparty, paying in return the return of a basket of securities it holds (usually different from the index). This method can be very efficient in replicating the index but introduces counterparty risk: the risk that the bank with which the swap was agreed upon is unable to pay.
The choice between physical and synthetic depends on various factors related to the replicated index and the manager’s preferences. Physical replication (even optimized) is often considered more transparent and carries less counterparty risk compared to synthetic.
Liquidity
When deciding how to choose an ETF, a practical factor to consider is its Liquidity. Since ETFs are traded on stock exchanges like stocks, liquidity refers to how easily and quickly you can buy or sell a large number of units of that ETF on the market, keeping the price close to its real value.
An ETF is considered liquid when:
- It has high daily trading volumes: Many investors actively buy and sell that ETF every day.
- It has a narrow bid-ask spread: The difference between the maximum price a buyer is willing to pay (“bid” price) and the minimum price a seller is willing to accept (“ask” price) is very small.
Good liquidity is advantageous for the investor because it reduces the implicit costs associated with the spread (the smaller the spread, the lower the transaction cost) and makes it easier to enter and exit a position quickly at the desired price.
An ETF’s liquidity depends not only on the trading volume on the market but also on the liquidity of the underlying securities that make up the index. ETFs on major indices with large assets under management tend to be very liquid.
You can find information on trading volumes and the spread on online trading platforms and websites specializing in ETF data.
The Fund Size
When evaluating how to choose an ETF, another piece of data that investors consider is the Fund Size, usually expressed in terms of Net Assets Under Management (Net Assets). This number represents the total value of investments held by the ETF.
A large fund size, such as the EUR 1,058,398,733 (data as of 08/05/2025) that we saw for the iShares Core MSCI World UCITS ETF (IWLE), indicates that the ETF has attracted a significant amount of capital from investors.
Why consider the size?
- Stability and Probability of Survival: Larger funds are generally more profitable for the manager and therefore less at risk of being closed or liquidated (an event which, although managed to protect the investor, can cause minor inconveniences).
- Correlated Liquidity: Often, but not always, a larger fund size is correlated with greater liquidity on the market, as there are more investors buying and selling units.
- Minor Economies of Scale: In some rare cases, very large funds might benefit from slight economies of scale that are reflected (indirectly) in costs, although the TER remains the primary indicator.
A small fund is not necessarily a “bad” ETF, but a very large one often offers greater peace of mind in terms of continuity and, potentially, liquidity.
The Trading Currency and the Benchmark Currency
When you look at an ETF, you often encounter different currencies, and understanding the difference is important. The two main concepts are:
- Trading Currency (or Listing Currency): This is the currency you use to buy and sell ETF units on a specific stock exchange. For example, the iShares Core MSCI World UCITS ETF (IWLE) is listed and traded in EUR on Borsa Italiana (as you saw in the data “Valuta della serie: EUR”). This means you buy and sell it using Euros.
- Fund Base Currency / Benchmark Currency: This is the currency in which the assets the ETF holds (or simulates) are denominated and/or the currency in which the benchmark index is calculated. The MSCI World index, for example, is calculated in USD (US Dollars), and the assets of the ETF that replicates it are primarily in dollars or other non-Euro currencies. In the example of the IWLE, you saw “Valuta di base: USD” and “Indice benchmark: MSCI World Net TR Index” (whose index is calculated in USD).
Why is it important?
Because if you invest in an ETF listed in Euros (Trading Currency) but that replicates an index in Dollars (Benchmark Currency), your final return will be influenced not only by the index’s performance but also by the trend of the EUR/USD exchange rate. If the Dollar strengthens against the Euro, your investment in dollars (the replicated index) will be worth more in Euros, and vice versa if the Dollar weakens.
Most ETFs are “unhedged” (not covered against exchange rate risk), meaning you are exposed to currency fluctuation. There are also “hedged” ETFs that try to neutralize currency risk using derivatives, but they have additional costs (higher TER) and greater complexity.
In most cases, for long-term investments in global indices, currency risk tends to balance out over time, and unhedged ETFs (cheaper) are often preferred. But it is essential to be aware of this currency exposure.
The Dividend Policy (Accumulation vs. Distribution)
Investments held by an ETF (stocks, bonds) can generate income, such as dividends from stocks or coupons from bonds. The Dividend Policy of an ETF determines what the manager does with this income. There are two main approaches:
- Accumulating ETFs (Acc): These ETFs automatically reinvest the dividends or interest received directly within the fund. The fund’s value (and therefore the NAV per unit) increases accordingly. The investor does not receive cash payouts but sees the value of their units increase. This approach is often preferred for long-term investments, as it leverages compounding without requiring manual reinvestment management.
- Distributing ETFs (Dist): These ETFs periodically distribute the income received (quarterly, semi-annually, annually) directly to investors as cash payments. In the example of the iShares Core MSCI World UCITS ETF (IWLE), you saw “Utilizzo dei rendimenti: Distribuzione” and “Frequenza di distribuzione: Trimestrale”. This means that the IWLE distributes dividends every three months.
The choice between accumulation and distribution depends on your preferences (do you want to reinvest automatically or receive cash?) and, in some countries, can have different tax implications. For long-term compounding, accumulation is usually more efficient.
Where to Find This Information (Beyond the Visual Example)
We have analyzed the key parameters that guide you on how to choose an ETF. But where can you actually find all this data for the various ETFs available on the market?
As we saw in the visual example above, the website of the ETF manager (such as iShares, Amundi, Vanguard, Xtrackers, etc.) is a primary and reliable source. Each manager provides detailed product sheets for their ETFs.
Other fundamental and official sources include:
- The KIID (Key Investor Information Document): A standardized document of a few pages summarizing the main characteristics of the ETF, including costs, risk profile, and past performance. It is mandatory and easily accessible.
- The Full Prospectus: A much more detailed document than the KIID, containing all the legal and operational information of the ETF.
- Specialized ETF Screening and Comparison Platforms: There are numerous specialized websites (such as JustETF, Morningstar, Bloomberg, etc.) that collect data on thousands of ETFs and offer powerful tools to search, filter, and compare ETFs based on all the parameters we have discussed. These platforms are valuable tools for research.
It is good practice to consult multiple sources to compare data and get a complete picture before making an investment decision.
Summarizing: Your Process for How to Choose ETFs
After analyzing the fundamental parameters, you might wonder how to concretely choose an ETF among the many available for a given index. Here is a simple process you can follow:
- Define your investment objective and strategy: Understand what you want to replicate. Do you want a global stock index, a bond index of a certain type, a specific sector? This is the basis of your choice.
- Identify ETFs that replicate that index: Use a screening platform or a broker’s website to find all available ETFs that track the index you have chosen.
- Compare candidates based on key parameters: For ETFs replicating the same index, compare the parameters we discussed: look for the lowest TER, a good (low) historical Tracking Difference, a replication method you are comfortable with, good liquidity, and an adequate fund size. Also consider the dividend policy based on your needs.
- Find the necessary information: Use the reliable sources we mentioned (manager’s website, KIID, specialized platforms) to collect data on the parameters for each ETF you are considering.
- Choose the one that best aligns with your criteria: Based on the comparison of parameters and your priorities, select the ETF that you believe is the most efficient and suitable for your investment plan.
Following this process will help you make a more informed and aware choice, looking beyond the surface and analyzing the factors that truly matter for the long-term performance of your ETF investment.
Conclusion
We have seen that knowing how to choose an ETF goes beyond simply identifying the index you want to replicate. It is a process that requires analyzing fundamental parameters such as the TER, Tracking Difference, replication method, liquidity, fund size, currency, and dividend policy.
There is no universally “best” ETF, but there is one that is best suited to your specific objectives and investment strategy. Taking the time to analyze these parameters, using the reliable sources available (manager websites, KIID, screening platforms), allows you to make an informed and conscious choice.
Investing in ETFs can be an efficient way to diversify, but choosing the right instrument within the vast offering is a crucial step to maximize the chances of achieving your long-term financial goals. Use the information and process we have described as a starting point for your research.