
How to Read a Company’s Financial Statement: The Essential Guide for Investors
In the world of investments, making informed decisions is crucial for your financial stability. Therefore, understanding how to read a company’s financial statement is the foundation for evaluating a company’s “true value,” going beyond simple market fluctuations. The financial statement is, in fact, a company’s financial “ID card,” an essential document for anyone looking to seriously engage in fundamental analysis. Without this skill, the financial indicators we’ll discuss in the future would have little meaning.
A financial statement isn’t just a pile of numbers for accountants; it’s a company’s financial “ID card,” a document that tells its economic story and current health. Understanding how to read a financial statement is, therefore, the most important skill for anyone looking to seriously engage in fundamental analysis. Without this foundation, the financial indicators we’ll discuss in the future would have little meaning.
In this article, we’ll shed light on the company financial statement. We’ll guide you through its three main components, simply explaining what each represents and what crucial information you can glean from them. Get ready to discover a company’s “x-ray”!
The Three Fundamental Components of the Financial Statement
To understand a company financially, it’s essential to get familiar with its main documents: its financial statements. Don’t worry, they’re not as complicated as they seem! Ultimately, a company’s financial statement is made up of three fundamental documents, each offering a different perspective on the business’s financial health.
Consider this analogy: Imagine you want to understand a person:
- It’s not enough to know how much they earn.
- It’s not enough to know what they own.
- It’s not enough to know how they spend
Instead, you need all this information together to get a complete picture. Similarly, for a company, you need to analyze all three “pieces” of the financial statement to get a clear and complete view. These three documents are interconnected and complement each other, telling a financial story that’s larger and more accurate than any one of them could tell alone.
The Balance Sheet: The Financial Snapshot
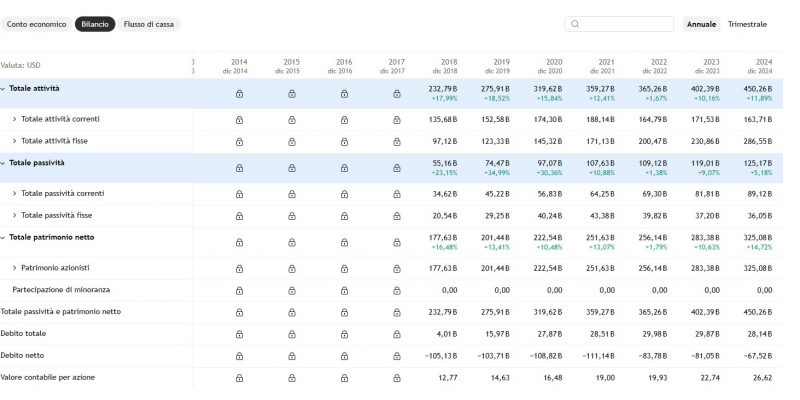
Let’s start with the Balance Sheet, one of the fundamental financial statements. Think of the Balance Sheet as a snapshot taken at a specific moment in time (for example, on December 31st of a given year). Crucially, it shows us what a company owns, what it owes to others, and what value remains for its owners at that exact point.
To simplify, the Balance Sheet answers these questions:
- What does the company own? (Assets): These are the economic resources the company possesses that generate value. They can be tangible goods (factories, machinery, inventory), cash in the bank, or money owed by customers.
- Example: If you have a computer, some books, and 100 euros in your pocket, these are your “assets.”
- What does the company owe to others? (Liabilities): These are financial obligations, meaning the debts the company must pay to third parties. They can include bank loans, debts to suppliers, or taxes to be paid.
- For instance: If you have a mortgage on your home or a bank debt for a loan, these are your “liabilities.”
- What is the company worth to its owners? (Equity): This is the portion of assets that remains after all liabilities have been deducted. It represents the “net” value belonging to shareholders. It’s the capital invested by the owners plus any profits that have been reinvested in the company.
- In other words: If you add the value of your assets and subtract your debts, what remains is your “equity.”
The fundamental relationship of the Balance Sheet is a simple yet powerful equation:
Assets = Liabilities + Equity
Essentially, this formula tells us that everything a company owns is financed either by someone else, like its creditors (liabilities), or by its owners/shareholders (equity).
The Income Statement: Performance Over a Period
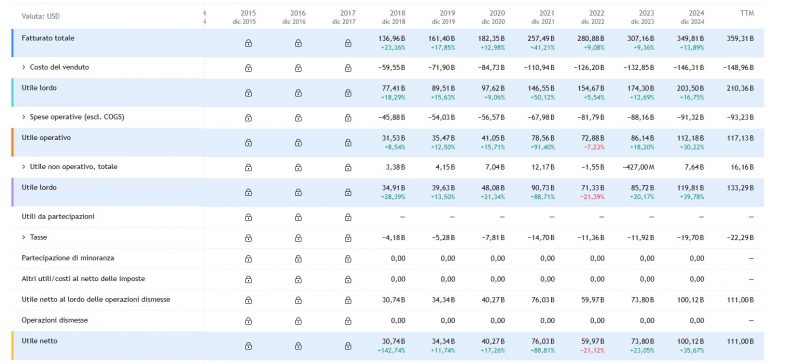
If the Balance Sheet is a “snapshot” of a company’s financial situation at a given moment, the Income Statement is like a video showing its performance over a specific period of time. This period is usually a quarter or a year. Essentially, the Income Statement tells you whether the company generated a profit (utile) or a loss and how it got there.
Think of it this way: the Income Statement as a report of a company’s ins and outs over a period. It shows you how much wealth it produced (revenue) and what costs it had to incur to produce it.
Here are the key items you’ll find on the Income Statement:
- Revenue (Sales): This is the first and most important item. It represents the total money the company earned from selling its products or services during the reporting period.
- Example: If a company sells 100 cars at 20,000 euros each, its revenue will be 2,000,000 euros.
- Cost of Goods Sold (COGS): These are the direct costs to produce what the company sold. It includes materials, direct labor, and manufacturing expenses.
- Example: The cost of raw materials to build those 100 cars, or the wages of the workers who assembled them.
- Gross Profit: This is calculated by subtracting the Cost of Goods Sold from Revenue. It shows you how much money remains from sales after covering the direct production costs.
- Operating Expenses: These are all other costs necessary to run the business, but not directly tied to production. They include selling, general, and administrative (SG&A) expenses, research and development, etc.
- Example: Administrative staff salaries, office utility bills, marketing expenses, office rent, costs for developing new car models.
- Operating Income (EBIT – Earnings Before Interest and Taxes): This is the profit generated from the company’s core operations before considering interest on debt and taxes. It’s an excellent indicator of its operational efficiency. Sometimes, reference is also made to EBITDA (Earnings Before Interest, Taxes, Depreciation, and Amortization), another operating profit indicator that also excludes depreciation and amortization, which we will explore in the future.
- Interest Expense: The expenses the company pays on its debts.
- Taxes: The income taxes the company owes to the government.
- Net Income (Profit): This is the “bottom line” of the Income Statement and probably the most watched item. It represents the total profit the company generated during the period after all expenses (including operating costs, interest, and taxes) have been paid. This is the money that can be distributed to shareholders as dividends or reinvested in the company.
Simplified Income Statement Calculation Example:
Let’s see how these items connect with a hypothetical numerical example for the company “Gamma Tech”:
- Revenue (Sales): € 1,000,000 (Total money earned from sales)
- Less: Cost of Goods Sold (COGS): € 300,000 (Direct cost to produce the goods or services sold)
- = Gross Profit: € 700,000 (€ 1,000,000 – € 300,000)
- Less: Operating Expenses: € 400,000 (Administrative salaries, marketing, rent, R&D)
- = Operating Income (EBIT): € 300,000 (€ 700,000 – € 400,000)
- Plus: Depreciation and Amortization: € 50,000 (Assumed value for this example)
- = EBITDA: € 350,000 (€ 300,000 + € 50,000 – an indicator of operational “cash profitability”)
- Less: Interest Expense: € 50,000 (Cost of borrowed money)
- = Earnings Before Taxes (EBT): € 250,000 (€ 300,000 – € 50,000)
- Less: Taxes: € 75,000 (Assuming a 30% tax rate on € 250,000)
- = Net Income: € 175,000 (€ 250,000 – € 75,000)
As you can see, by starting with revenue, you arrive, step by step, at net income, the final figure that indicates the company’s true profitability for that period. EBITDA gives us another perspective on the company’s operational capacity, before considering non-cash charges like depreciation, interest, and taxes.
The Cash Flow Statement: Where Does the Money Go?
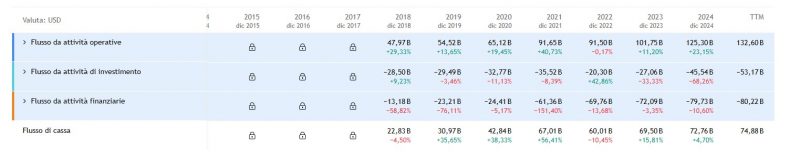
After the Balance Sheet (the snapshot) and the Income Statement (the profit video), we arrive at the Cash Flow Statement. This document is crucial because it shows a company’s actual cash movements (money flowing in and out) over a given period. Unlike the Income Statement, which can include revenues and costs even if the money hasn’t yet been collected or paid (accrual basis), the Cash Flow Statement focuses only on actual cash. It’s like tracking all the money going in and out of your wallet.
Why is it so important? A company might be profitable on paper (have good net income on the Income Statement), but if it doesn’t have enough liquidity to pay bills, salaries, or suppliers, it can still run into trouble. The Cash Flow Statement tells you if the company is able to generate cash from its operations, investments, and financing activities.
It is divided into three main sections:
- Cash Flow from Operating Activities: This is the most important section. It measures the cash generated or used by the company’s core operations. Essentially, it tells you how much money the company produces (or consumes) from selling its products or services, before considering investments or financing. This is where you see if the “core” business is self-sufficient in terms of liquidity.
- Example: Money collected from sales minus money paid to suppliers, employees, and for other operating expenses.
- Cash Flow from Investing Activities: This section shows the cash used to buy or sell long-term assets, such as property, plant, and equipment (CAPEX – Capital Expenditures), or investments in other companies. A negative cash flow in this section can be a good sign if the company is investing to grow in the future.
- Example: Money spent to buy new machinery for the factory or to acquire a small startup. Money received from selling an old building.
- Cash Flow from Financing Activities: Here you’ll find the cash generated or used by activities involving debt and equity. This includes issuing new shares or buying back treasury stock, issuing or repaying debt, and paying dividends to shareholders.
- Example: Money received from a new bank loan or from issuing new shares. Money paid to repay a debt or to distribute dividends.
The sum of these three cash flows gives you the Net Change in Cash, which tells you how much the company’s overall liquidity increased or decreased during the period.
Conclusion
We’ve taken quite a journey through the three fundamental components of a company’s financial statements. I hope you can now see them not as a pile of complex numbers, but as a company’s financial story, told from three different yet complementary perspectives.
Let’s briefly recap:
- The Balance Sheet is a snapshot of the financial situation at a given moment: what the company owns, what it owes, and what it’s worth to its owners.
- The Income Statement is a video of performance over a period: it shows you whether the company generated profits (and how).
- The Cash Flow Statement is a map of cash flows: it reveals where money came in and went out, showing the company’s true liquidity.
These three documents should never be read in isolation. To get a complete and reliable picture, it’s crucial to interpret them together, because they influence and clarify each other. A company with high profits on the Income Statement, but with little cash on the Cash Flow Statement, could be in trouble. Conversely, a company with a solid Balance Sheet and good cash flows (Cash Flow Statement), but low profits (Income Statement), might be undervalued.
Understanding how to read a financial statement is your essential foundation for fundamental analysis. It’s the language in which companies communicate their health and prospects.
What Happens Next?
Now that you have the foundation for reading company financial statements, you’re ready for the next step. In the upcoming articles of this series, we’ll delve into the specific financial indicators derived directly from these documents. We’ll analyze in detail metrics like P/E, EBITDA, Market Cap, ROE, and many others, explaining how to calculate them and, most importantly, how to interpret them to make more informed investment decisions.
“Don’t miss the next posts!”