
The Foundations of Trading: Horizontal Support and Resistance
Table of contents
Technical analysis may seem complex, but it is built upon simple and intuitive principles. Among these, the concepts of identify support and resistance are the crucial starting point. These are not just lines drawn on a chart; they represent key psychological points where demand and supply clash, defining future price movements. Knowing how to identify horizontal support and resistance is the first step in deciphering the language of the market.
What is Support? The Price “Floor”
A support level is a price area below the current market value where strong buying interest is concentrated, preventing the price from falling further. Think of support as an invisible “floor”: every time the price approaches this area, buyers spring into action, propping up the price and pushing it back up.
- How to Identify It: A support is identified by two or more lows (bottoms) that the price has touched and bounced off. The more times it touches, the stronger the support.
- What It Indicates: It signals a zone where buyers deem the price attractive and are ready to intervene en masse.
What is Resistance? The Price “Ceiling”
Conversely, a resistance level is a price area above the current market value where selling interest is very high, blocking the price’s further ascent. Imagine resistance as an invisible “ceiling”: when the price reaches this area, sellers take over, pushing the price back down.
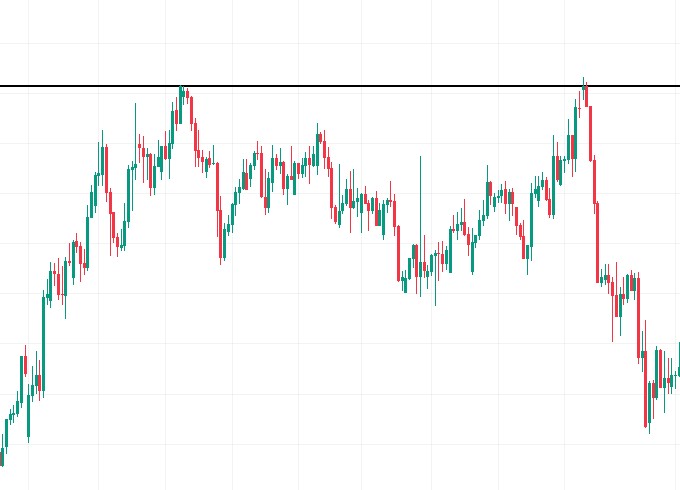
- How to Identify It: A resistance is identified by two or more highs (tops) that the price has touched and been pushed back from. The more times it touches, the stronger the resistance.
- What It Indicates: It signals a zone where sellers believe the price is too high and are ready to liquidate their positions.
The Psychology Behind Support and Resistance
These levels are not random; they are a visual representation of the market’s collective memory. Traders remember the prices at which the market previously reacted and act accordingly. A former buyer who missed a purchase at a support level may be motivated to buy at that price the next time the opportunity arises. Similarly, a seller who regretted not selling at a certain resistance price may rush to do so when the price returns there.
The Rule of Role Reversal
One of the most important features of support and resistance is their ability to reverse their roles once broken.
- When a Support is Broken: If the price decisively drops below a support level, that level often turns into a new resistance. Former buyers are now at a loss and will look to sell to break even, while new sellers will view the old support as a good bearish entry point.
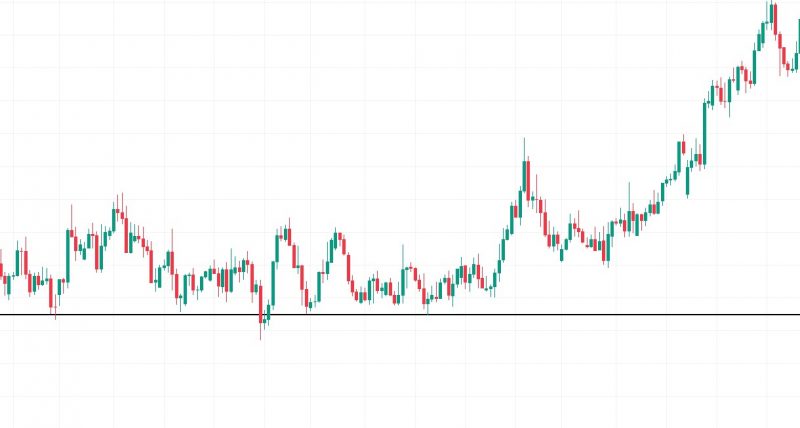
- When a Resistance is Broken: If the price decisively rises above a resistance level, that level turns into a new support. Buyers who did not enter on the uptrend will use the old resistance level as a new entry point to buy.
Applications in Trading and Risk Management
Using horizontal support and resistance offers two basic strategies, each with its own challenges and risk management methods.
1. Trading the Bounce: Buy at Support, Sell at Resistance
This strategy involves buying near a support level (anticipating an upward bounce) or selling near a resistance level (anticipating a downward bounce). The philosophy is “buy low, sell high.” To apply it successfully, traders look for confirmation signals, such as a candlestick reversal (e.g., a pin bar or a hammer) right at the level.
Risk Management is Key: The stop-loss must be placed just below the support level for a buy position, or just above the resistance level for a sell position. If the price breaks the level, the bounce hypothesis is invalidated, and the position must be closed to limit losses.
2. Trading the Breakout: Entering After the Break
This strategy involves entering the market only after a key level has been broken forcefully and decisively. It is based on the idea that once an area of strong demand or supply is overcome, the movement will accelerate in the direction of the break.
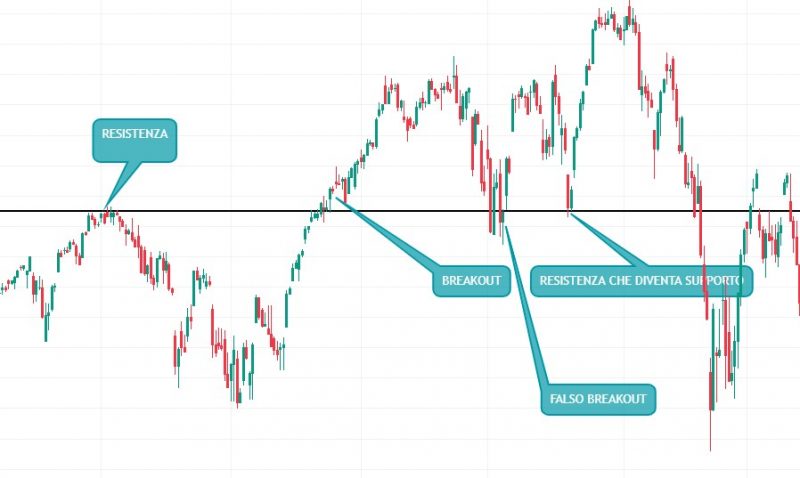
- The Importance of Volume: To confirm the validity of a breakout, look for a significant increase in trading volume. High volume indicates that a large number of market participants supported the break, making it more reliable. A breakout without volume is often a false signal, or “false breakout.”
- False Breakouts: A false breakout occurs when the price briefly moves past a support or resistance level only to quickly reverse and return inside. This phenomenon traps late-entering traders, causing losses. To avoid false breakouts, it is good practice to wait for a candle (e.g., on a daily chart) to close above the resistance or below the support before opening a position.
- Risk Management in Breakouts: Again, stop-loss placement is crucial. After a bullish breakout of resistance, the new support (the old resistance level) can be used as the reference point for the stop-loss.
While analyzing support and resistance is powerful on its own, its true potential is unleashed when combined with other tools. For example, a 50 or 200-period moving average coinciding with a horizontal support level significantly increases the importance of that level. Similarly, a resistance break coinciding with a strong signal from a momentum indicator (like the RSI) can offer a stronger and more reliable entry signal. This approach, known as joint analysis, is key to making more informed trading decisions.
Conclusion for Identify Support and Resistance
Understanding and knowing how to identify horizontal support and resistance is the first step in building a solid foundation in technical analysis. They are not a magic formula, but an essential lens for interpreting the supply and demand dynamics that move the markets. With practice and careful risk management, these concepts will become your most trusted allies in navigating the complex world of trading.