Technical Analysis: Understanding the Market Without Guessing
Table of Contents
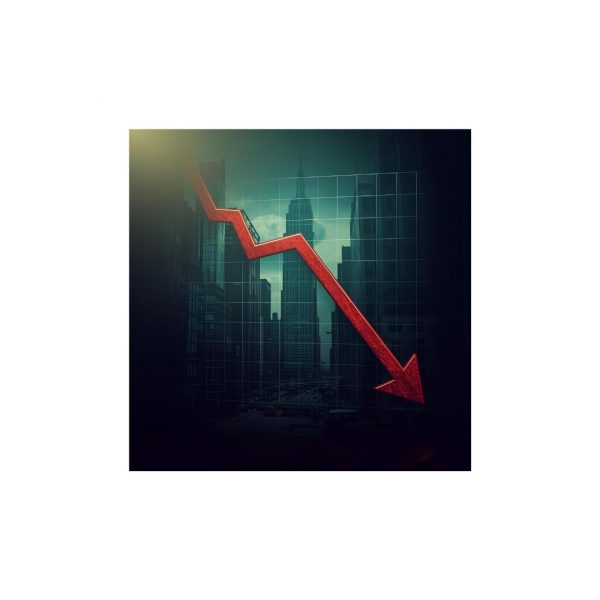
Have you ever wanted to understand the “why” behind price movements? What is technical analysis? Technical analysis is the key. It’s a practical and direct way to read the market, not with magic, but with logic.
While fundamental analysis looks at a company’s balance sheets and news, technical analysis focuses only on price movements. The idea is simple: the price already reflects all available information. By learning to read charts, you can discover the market’s intentions.
What is Technical Analysis: The Three Types of Charts
To analyze an asset, the first step is to choose a chart. Each one tells a different story.
The line chart is the simplest: it connects closing prices. It’s ideal for getting an overview, like looking at a mountain’s profile.
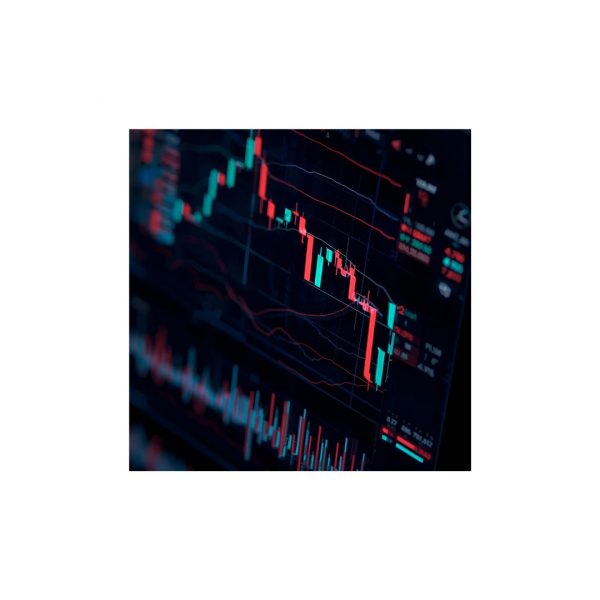
The candlestick chart is the most popular. Each candle shows the open, close, high, and low for a period. It gives you a quick idea of who is winning the “battle” between buyers and sellers.
The Heikin Ashi chart is similar to the candlestick chart but with a unique feature: it smooths out market noise. It helps you see the underlying trends more clearly by reducing false signals.
The Concept of Timeframe
Once you’ve chosen the chart type, you must decide on the timeframe. This is the period that each point, line, or candle represents. It can be a minute, an hour, a day, a week, or even a month.
A daily timeframe gives you a long-term overview.
A one-minute timeframe gives you a detailed, close-up view.
Choosing the right timeframe depends on your goal: if you trade quickly (day trading), you’ll use short timeframes; if you invest for the long term, you’ll use longer timeframes.
Indicators: Your Guides on the Chart
In addition to charts, you can use indicators. These are mathematical calculations that help you confirm or anticipate price movements. Think of them like a compass or a thermometer you add to your map: they give you extra information to make a decision. There are two main families: trend indicators that tell you the market’s direction, and momentum indicators that measure its speed.
The two most important concepts to know are support and resistance.
Support is like a floor: a price level where demand is strong, preventing the price from falling further.
Resistance is like a ceiling: a level where supply is high, blocking a further price increase.
Recognizing these levels helps you understand where the market might stop or change direction.
This is just the beginning. In the next articles, we will explore every tool, from indicators to chart patterns, to give you a complete toolbox for navigating the world of finance.